CDNOD Result
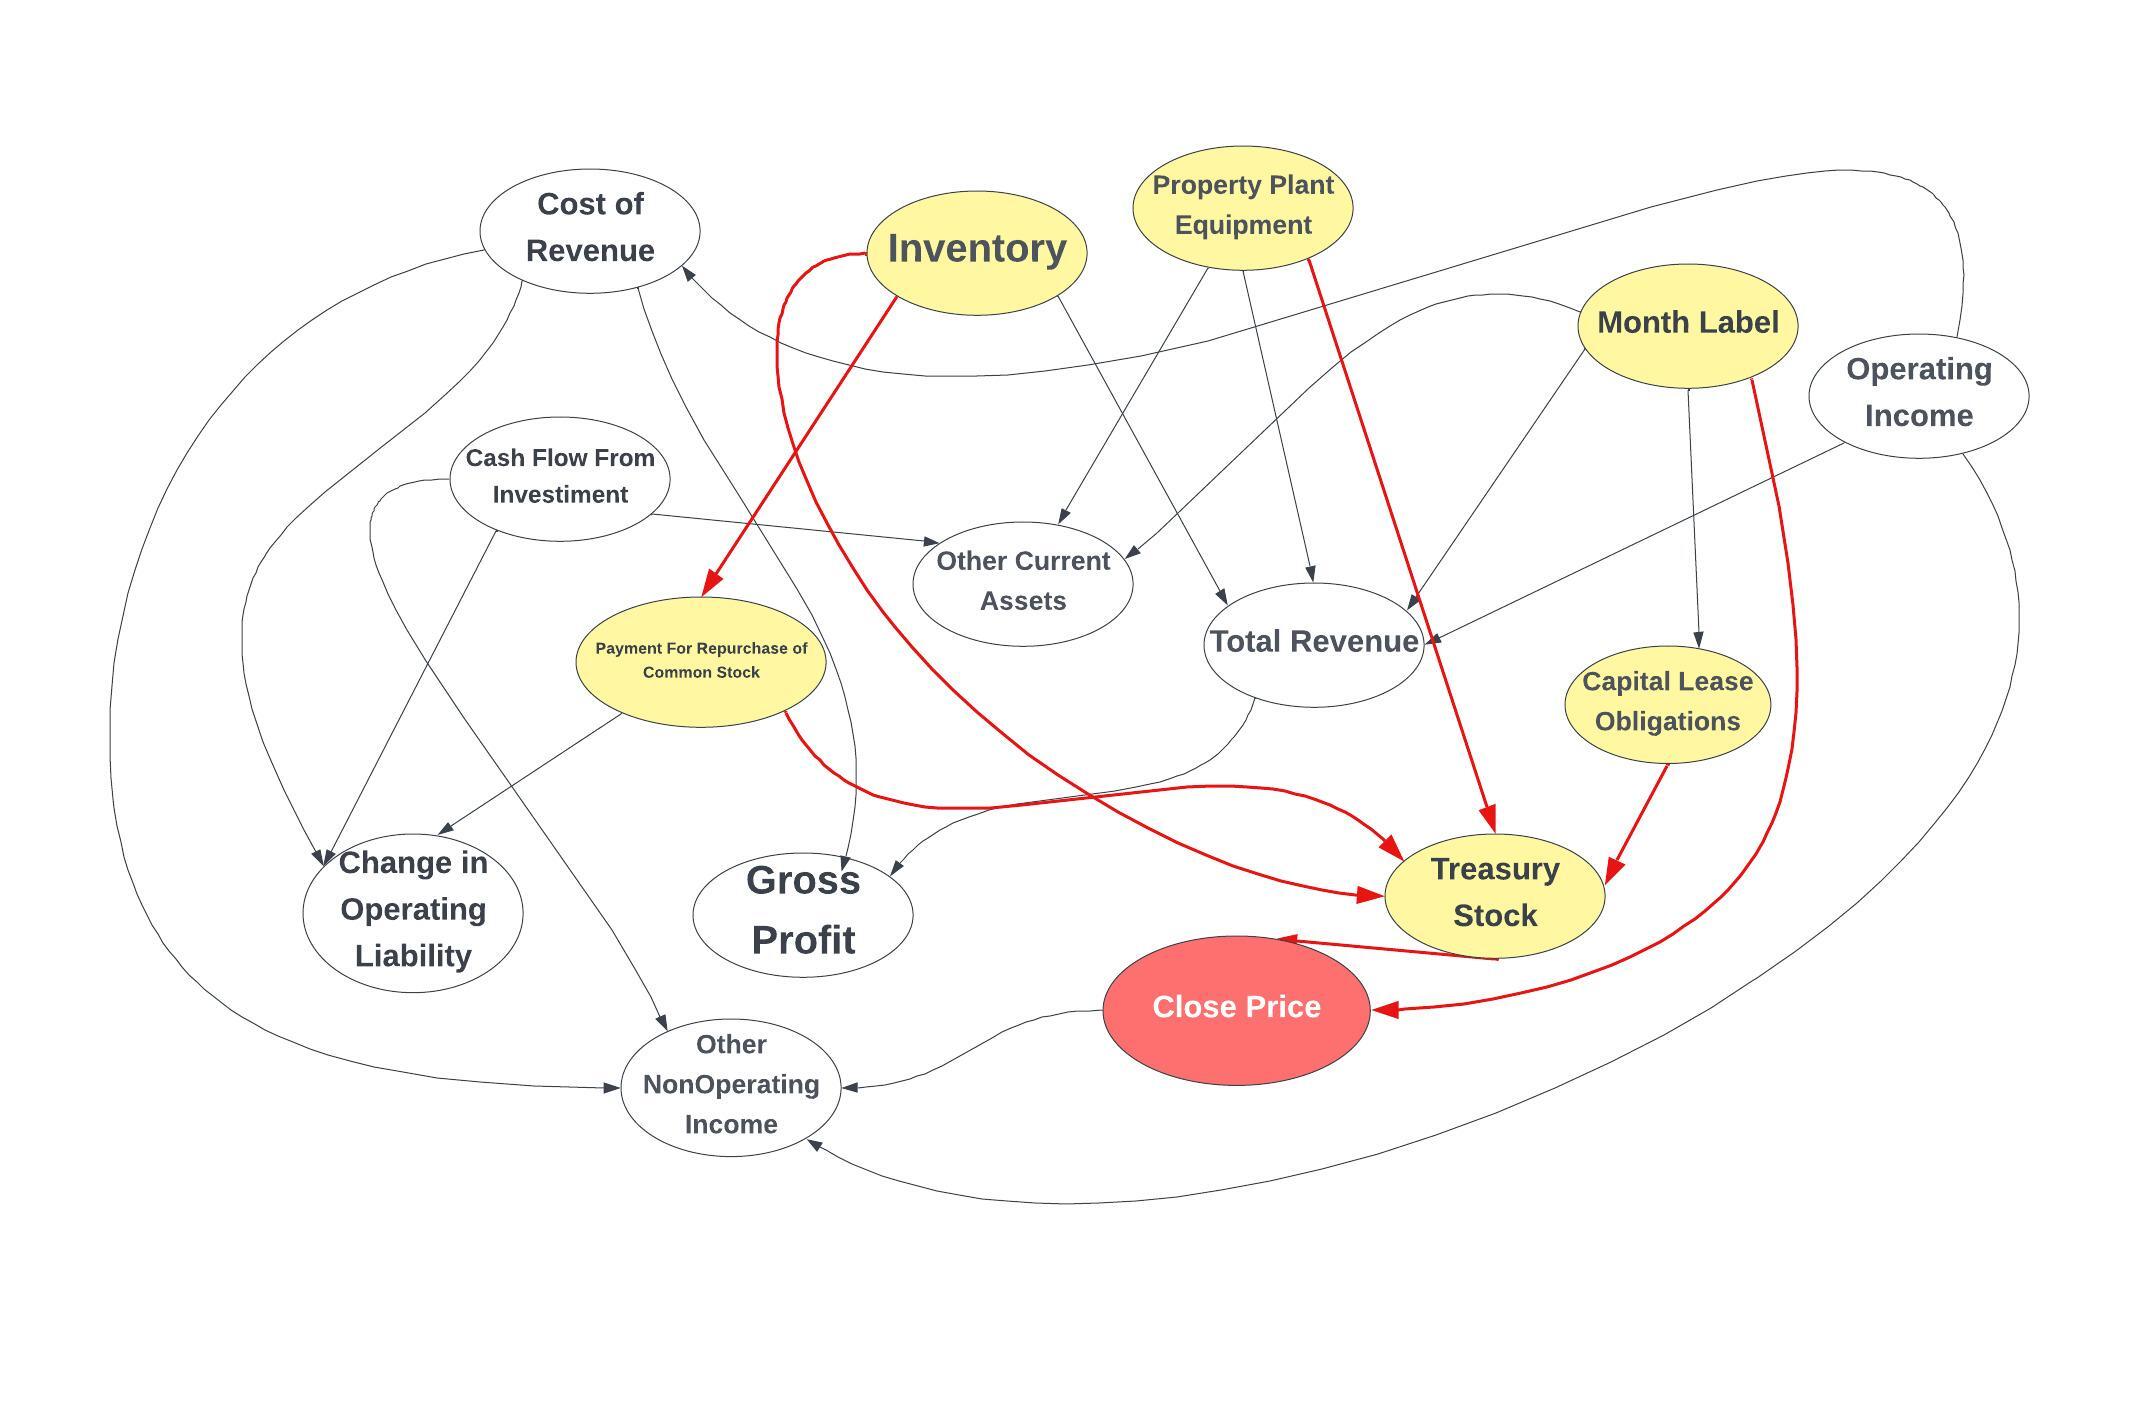
AT&T (T): Treasury Stock directly impacts AT&T's closing price, driven by Inventory, Prop-
erty, Plant & Equipment, and Capital Lease Obligations. These factors shape free cash flow,
enabling stock buybacks that reduce outstanding shares and boost the stock price. Since
AT&T relies heavily on infrastructure to deliver services, efficient capital allocation and liq-
uidity management are key to sustaining shareholder value.
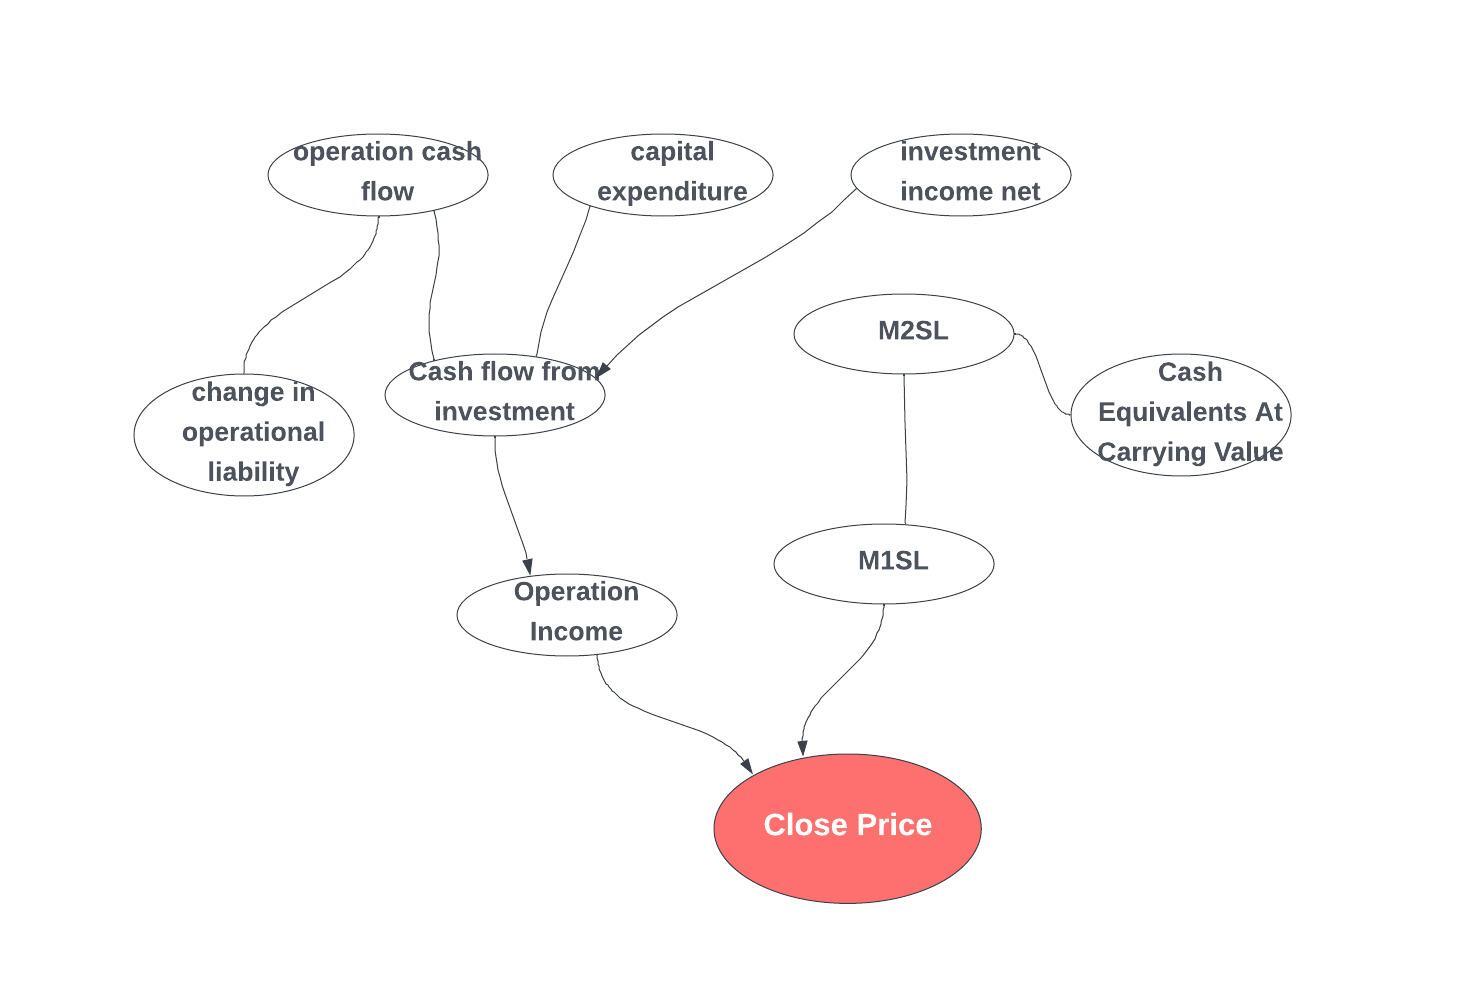
Amazon (AMZN): Operating Income and M1 Money Stock directly impact Amazon's clos-
ing price, driven by M2 Money Stock, Cash Equivalents, Investment Income, Capital Expen-
diture, and Cash Flows. These factors shape free cash flow. Given Amazon's infrastructure-
heavy model, efficient capital allocation and liquidity management are crucial for sustaining
shareholder value.
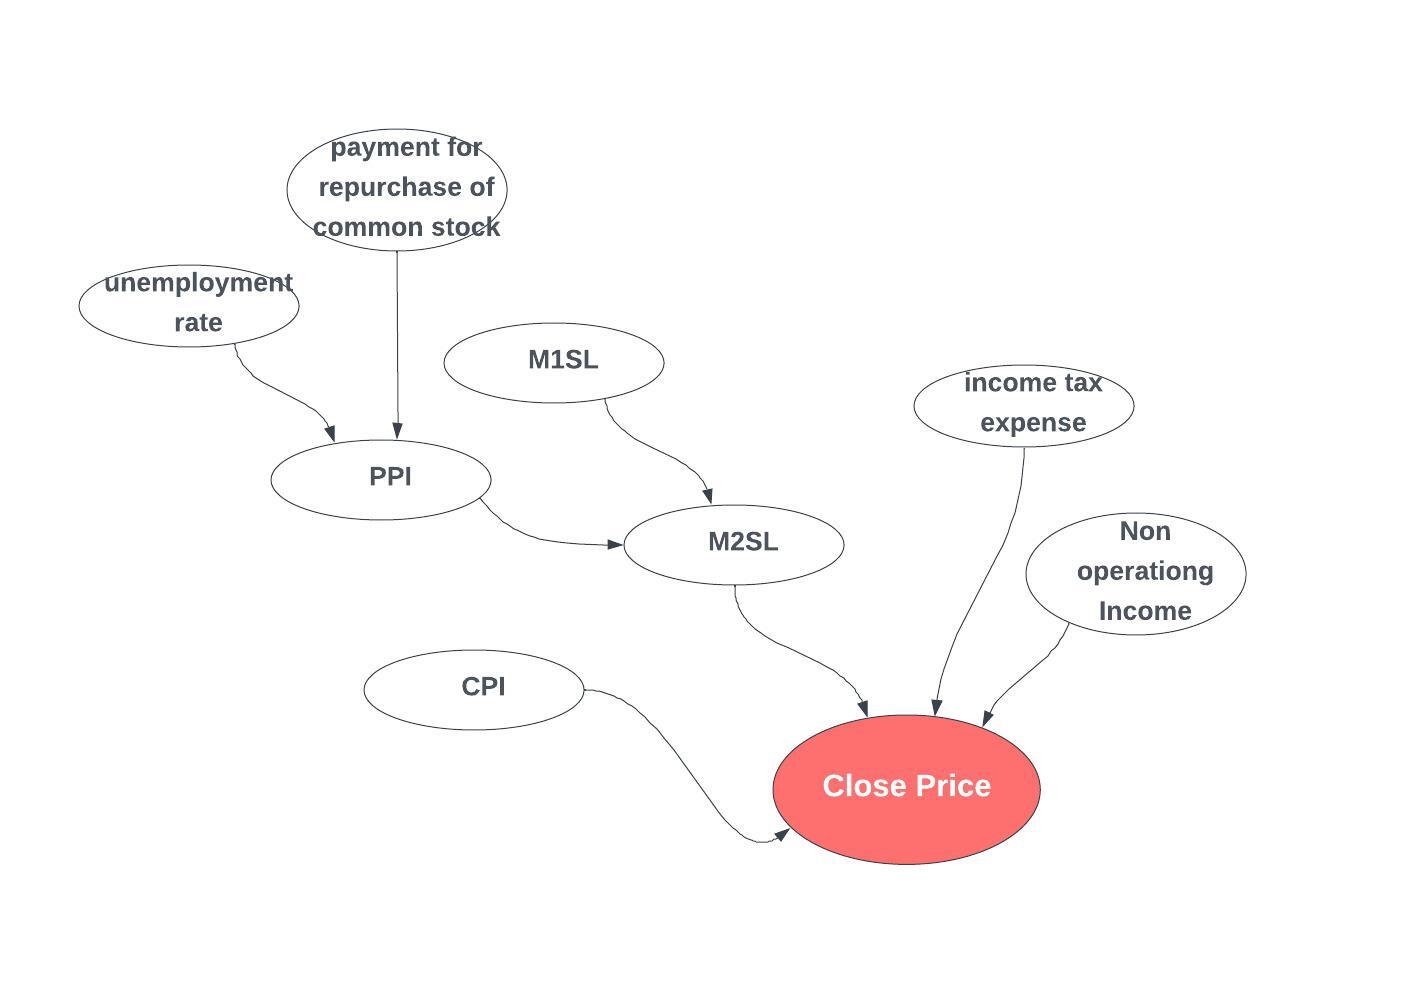
Google (GOOG): M2 Money Stock, Non-Operating Income, Income Tax Expense, and CPI
directly impact Google's closing price, driven by M1 Money Stock, PPI, stock repurchases,
and the Unemployment Rate. These factors affect Google's ability to invest, control ex-
penses, and execute buybacks. With its reliance on infrastructure and ad revenue, efficient
liquidity management is essential for sustaining shareholder value.
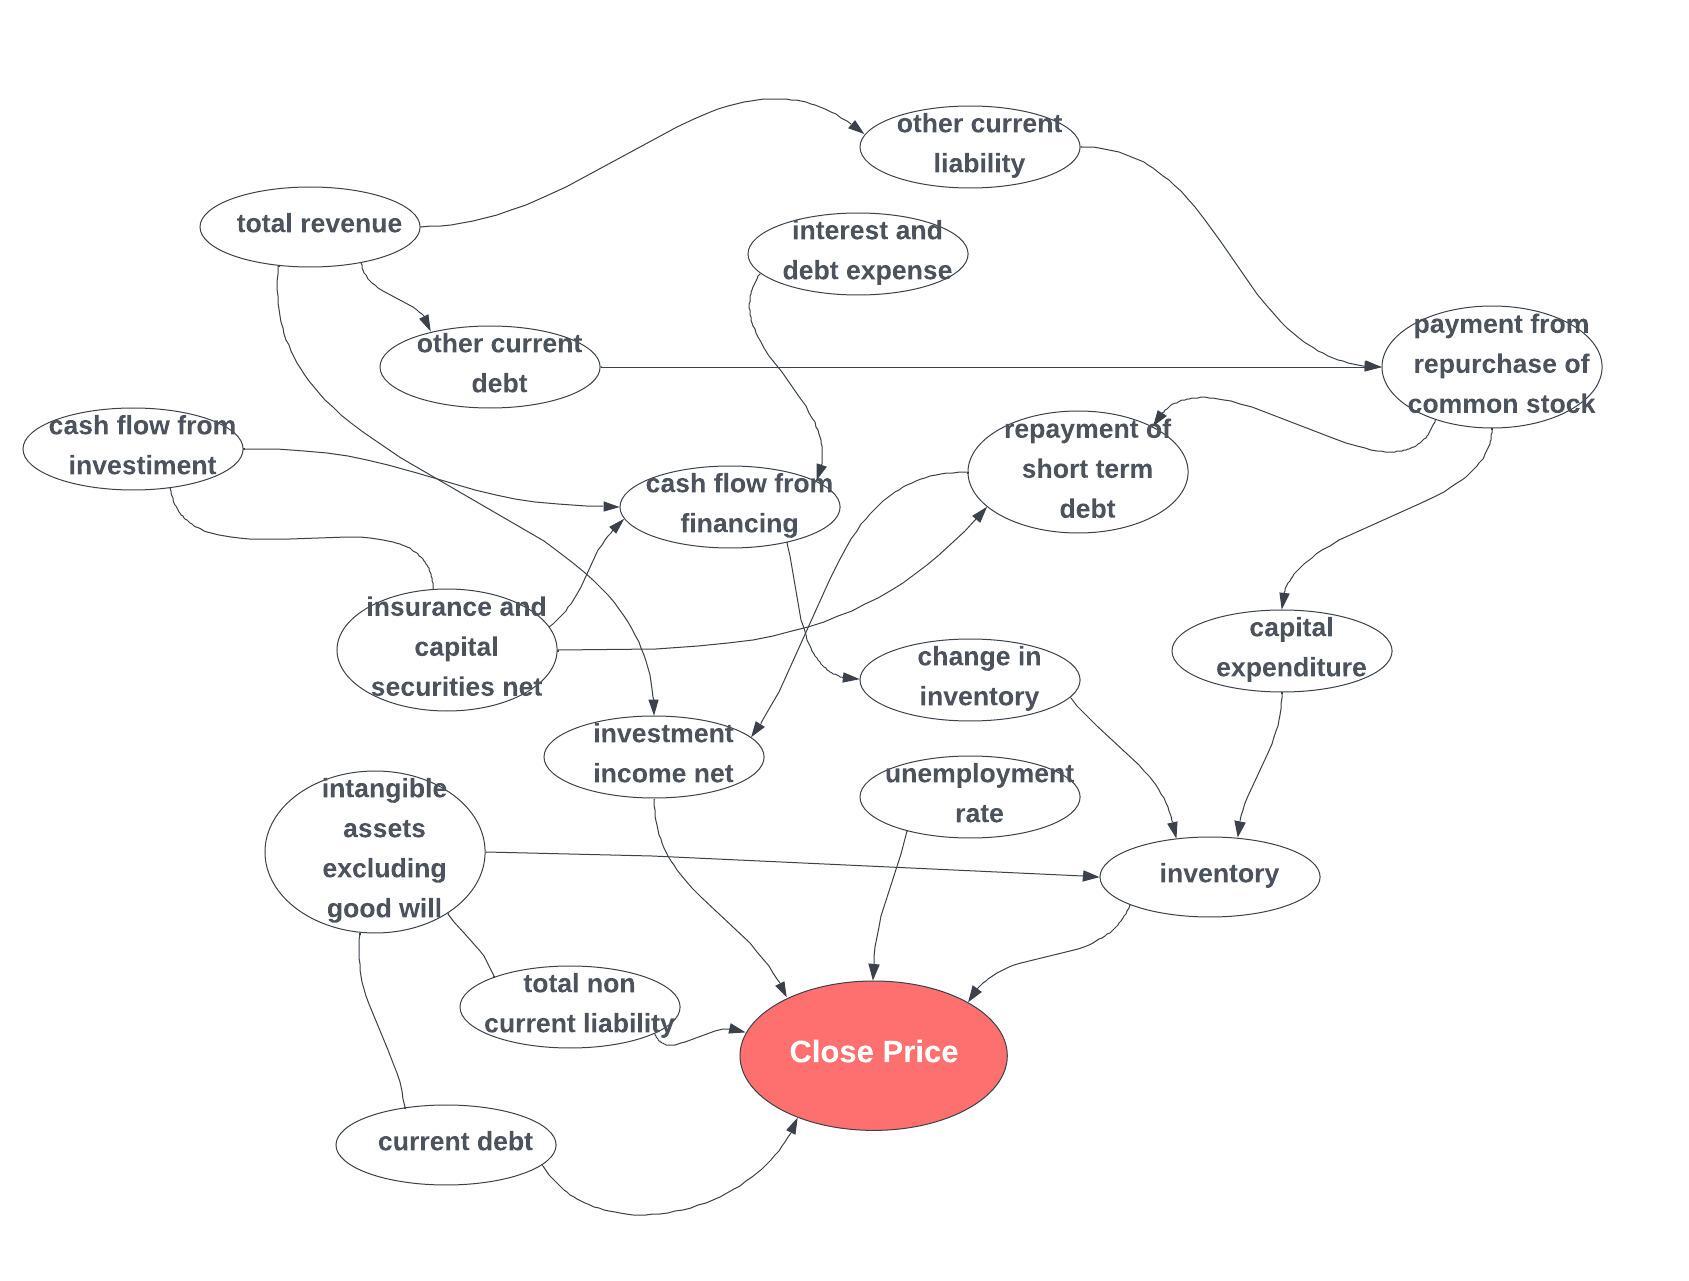
CVS (CVS): The Unemployment Rate, Inventory, Total Non-Current Liabilities, and Cur-
rent Debt directly impact CVS's stock price, driven by Capital Expenditure, Debt-Related Metrics, and Security Expenditure. With substantial debt, these factors reflect CVS’s ability
to manage financial obligations, sustain operations, and invest in growth, ultimately influ-
encing its stock performance. As a retail and healthcare company, CVS heavily relies on
human resources, making labor market conditions a key factor in its operational efficiency
and profitability.
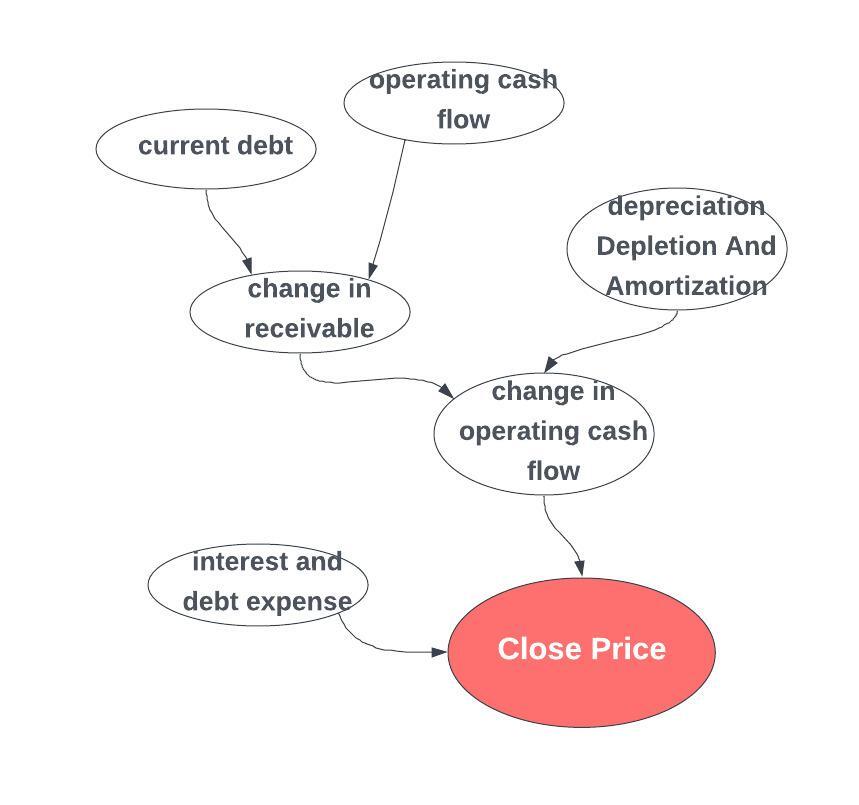
Abbott Laboratories (ABT): Changes in Operating Cash Flow, Interest, and Debt Expense
directly impact ABT's stock price, originating from Changes in Receivables, Current Debt,
Operating Cash Flow, and Depreciation, Depletion, and Amortization (DDA). As a health-
care company reliant on drug innovation, these factors influence cash availability, borrow-
ing costs, and profitability, all of which are critical to Abbott's ability to fund Research and
Development, expand operations, and return capital to shareholders.
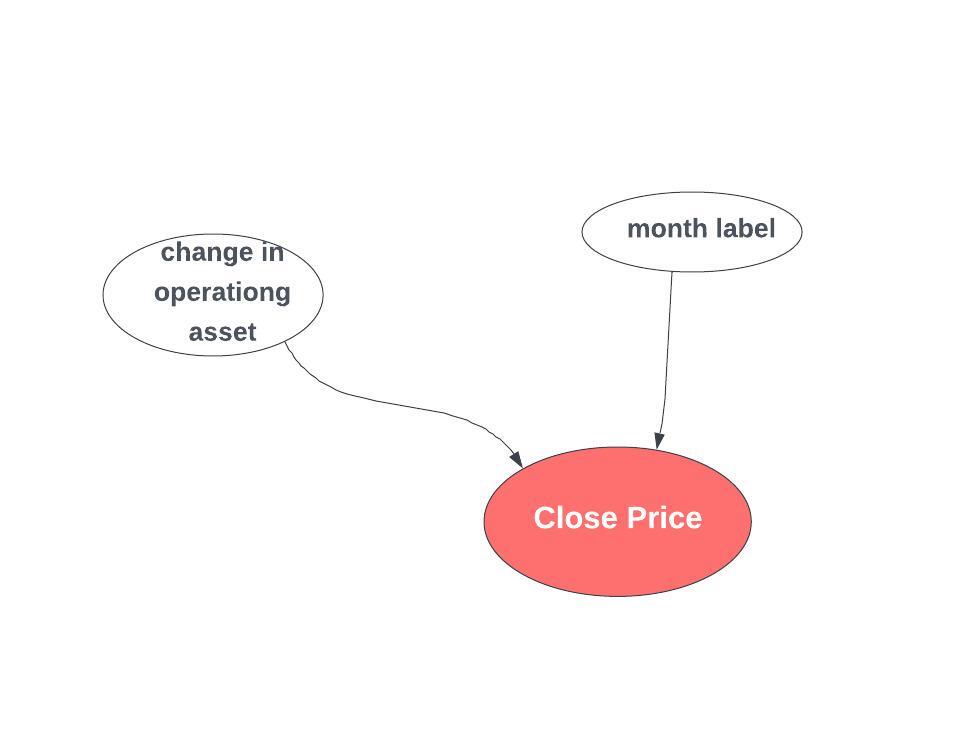
Amgen (AMGN): Changes in Operating Assets and Month Labels directly impact Amgen's
stock price, as fluctuations in inventory, receivables, and seasonal trends in drug sales can
affect revenue recognition and investor sentiment
AMZN
GOOG
T
AMGN
CVS
ABT
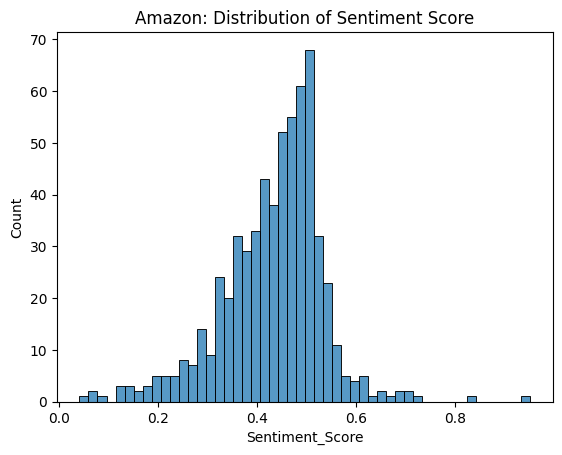
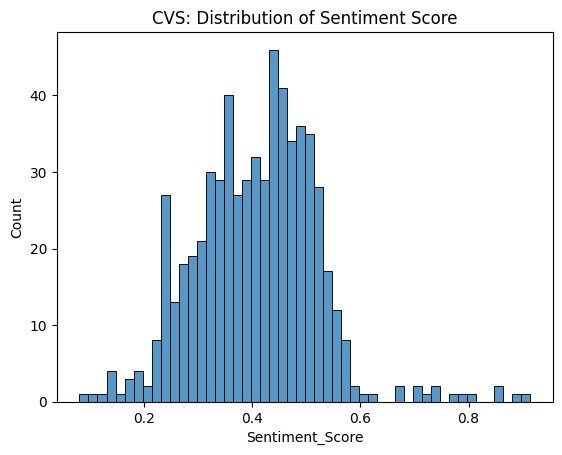
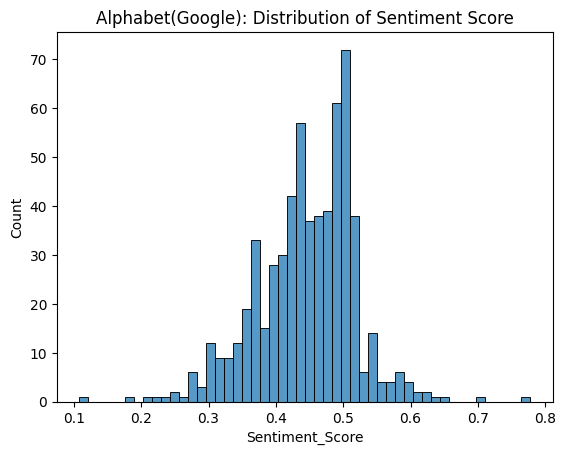
Figure: Sentiment Score Distribution of Stocks
