Overview

Our framework consists of three branches, integrating features from diverse sources, including historical stock prices, macro- and microeconomic factors, and Reddit posts to capture market sentiment.

For the first branch, we obtained economic indicators from FRED and Alpha Vantage. Using all available features, we applied CDNOD to learn the underlying causal relationships and select those with a significant impact on a company's closing price. After feature selection, we aligned the frequency of company-level and macroeconomic data through hypothesis testing to enhance external shock prediction.

For the second branch, we obtained historical stock data from the Yahoo Finance API. Using PCMCI+ for feature selection and lag optimization, we refined decision-making to better capture long-term stock trends based on historical patterns.

For the third branch, we obtained posts from the Reddit API and used FinBERT to generate daily sentiment scores for each company. The resulting sentiment scores were then integrated into DeepAR to enhance daily trend analysis.

project structure overview

Sentiment Analysis Module

Model

FinBERT - Specialized NLP model for financial text sentiment analysis.

Data Collection & Pre-processing
  • AMZN, GOOG, CVS GitHub Tweet Dataset (June 2020 - May 2023).
  • Collected Reddit posts and comments for additional sentiment data via Reddit API.
  • Applied time-scaled linear interpolation for data smoothing.
Sentiment Scoring

Weighted FinBERT confidence levels with normalization to 0-1 range.

Work Flow of Sentiment Analysis Module

Work Flow of Sentiment Analysis Module

Economic Impact Analysis Module

Economic Impact Framework
Data Collection

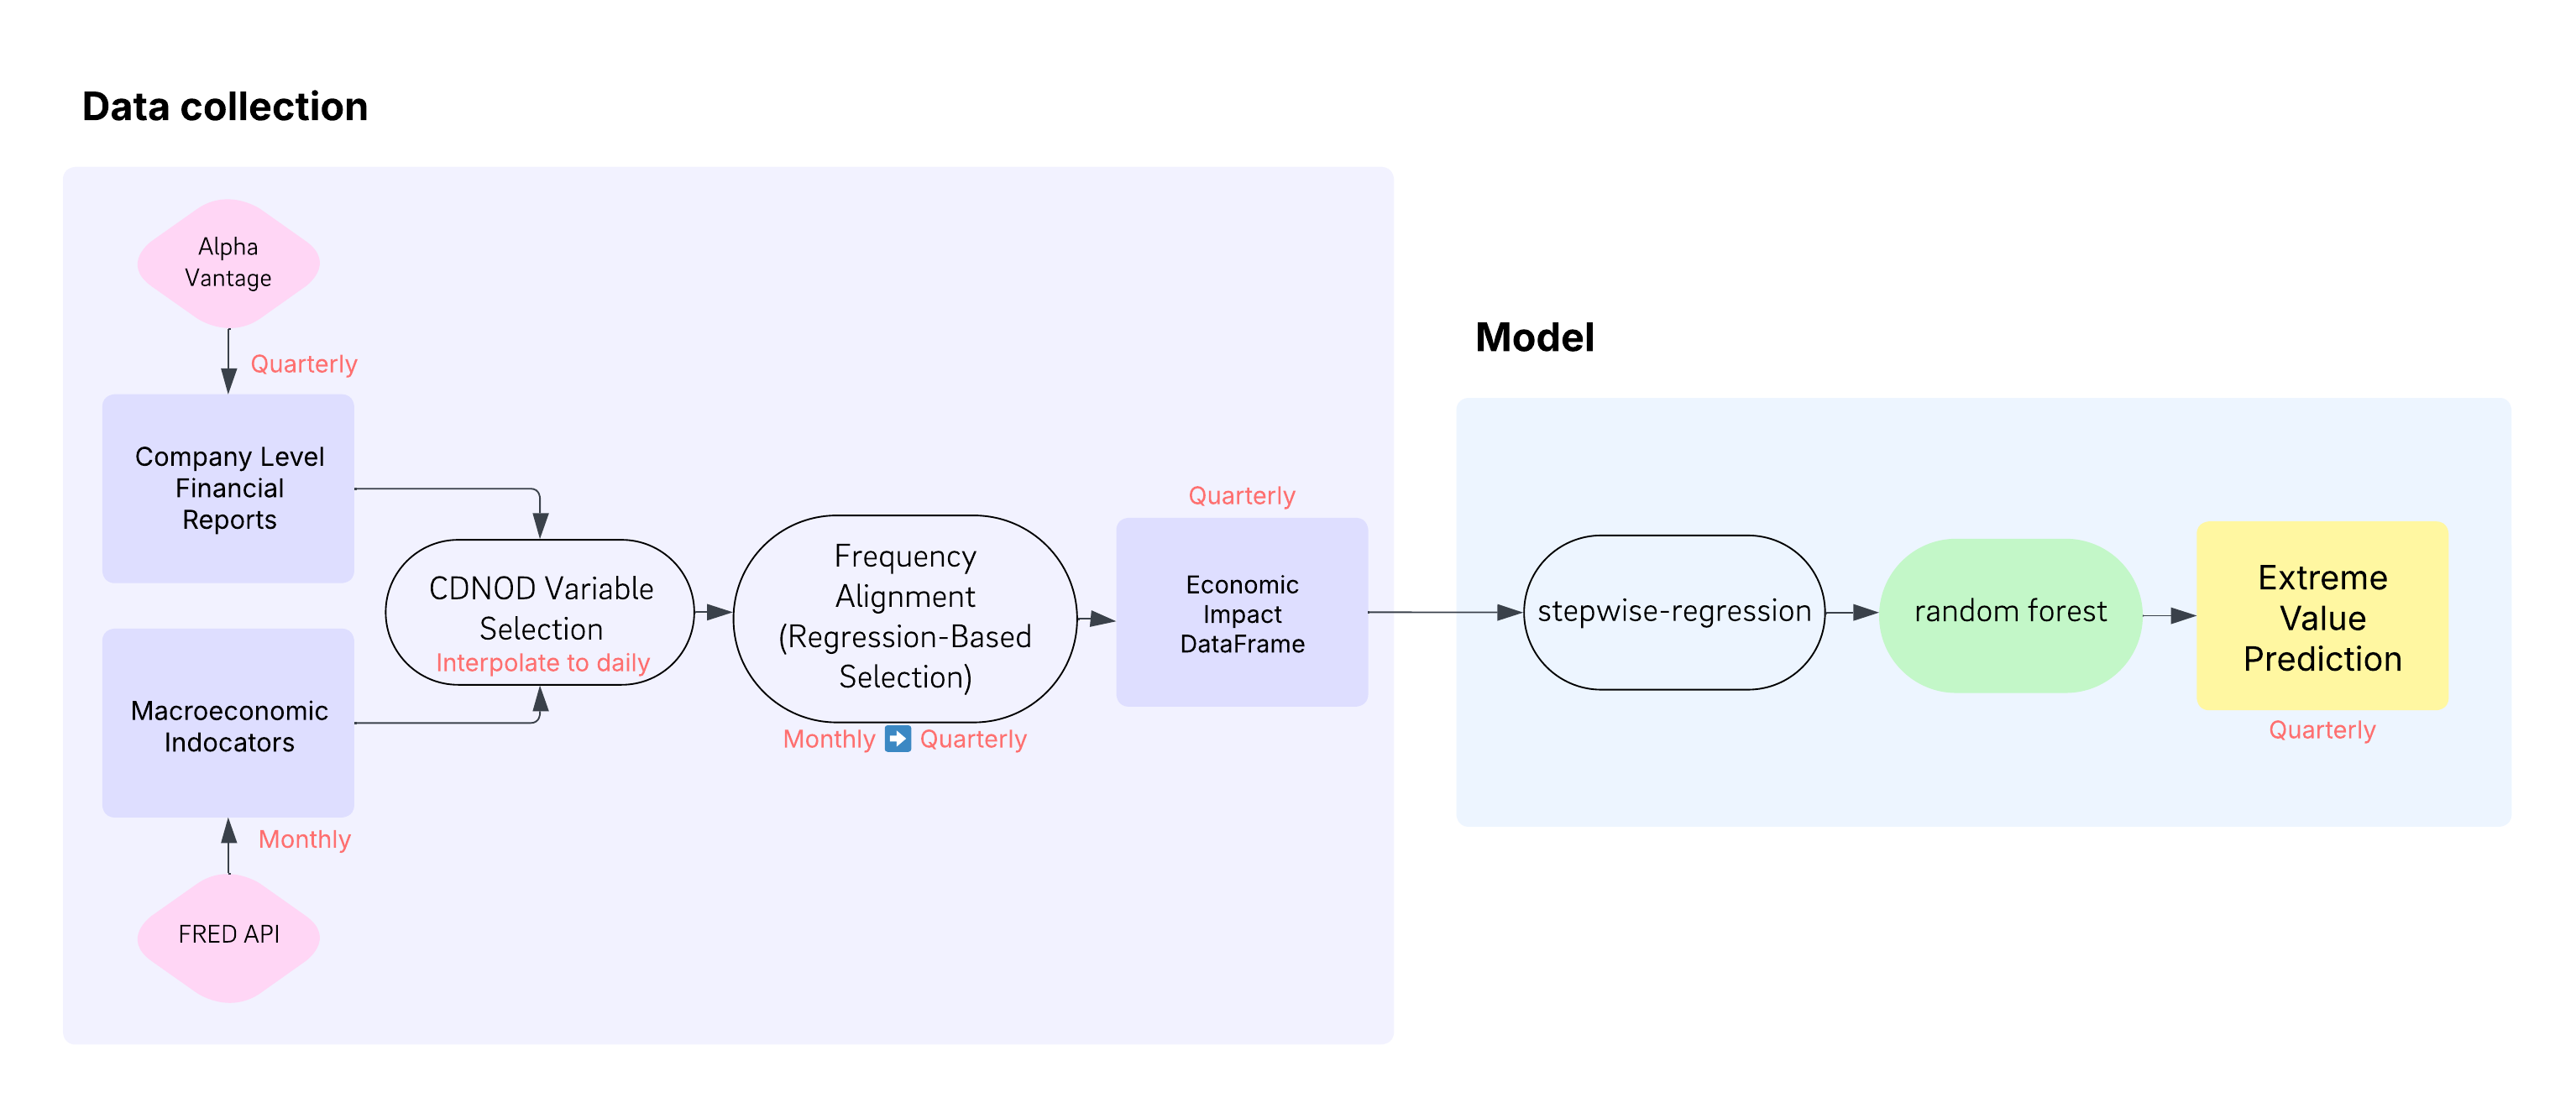
To fully capture the economic impact on stock returns, we gathered data from two different sources

  • Microeconomic Data: Quarterly company reports (balance sheet, cash flow).
  • Macroeconomic Indicators: Monthly Economic data (CPI, GDP).
Frequency Alignment

The key challenge arises from the inherent discrepancy in temporal granularity:macroeconomic and microeconomic indicators are typically reported on a monthly basis, while corporate financial statements adhere to a quarterly reporting cycle. To align these datasets, we mapped quarterly stock returns from daily price data and decomposed macroeconomic indicators into three monthly observations per quarter. Using OLS regression, we identified the most statistically relevant monthly indicator for each quarter. Finally, we merged company financial data with the selected macroeconomic features, ensuring temporal consistency for predictive modeling.

Feature selection through CDNOD

After interpolating economic factors with daily stock prices, we applied CD-NOD with monthly grouping and Fisher's Z-test at a 0.01 significance level to capture causal relationships between factors and stock price shocks. Defining impactful features

• have a direct edge to stock price.

• connect to stock price through causal pathways in the learned graph.

Stock Return Prediction Module

Our stock prediction system is designed to model uncertainty in the market. Unlike traditional models that only provide a single prediction, we generate a range of possible outcomes with their probabilities - similar to how experienced investors think about market risks.

Data Collection & Pre-processing

We collect historical data of 6 companies (3 Tech, 3 Healthcare) via Yahoo Finance API from Jun 2020 to Feb 2025, including daily metrics of opening/closing price, high, low, and volume. Our dataset contains 1,190 trading days per company, totaling 7,140 records, capturing both stable and volatile market periods. We calculate Daily return as:

Rt = (Pt - Pt-1) / Pt-1
Causal Feature Selection

Applied PCMCI+ algorithm for causal feature selection, identifying 8 key covariates based on their causal impacts. This advanced technique helps us distinguish true causal relationships from mere correlations, focusing on factors that actually drive stock returns:

  • Price-Based Features: Close price and trading volume
  • Technical Indicators: MA5 deviation, MACD with lag-2, intraday returns, volatility measures
  • Time-Based Features: Calendar effects (weekday and month patterns)
  • External Features: Sentiment scores from market news and social media
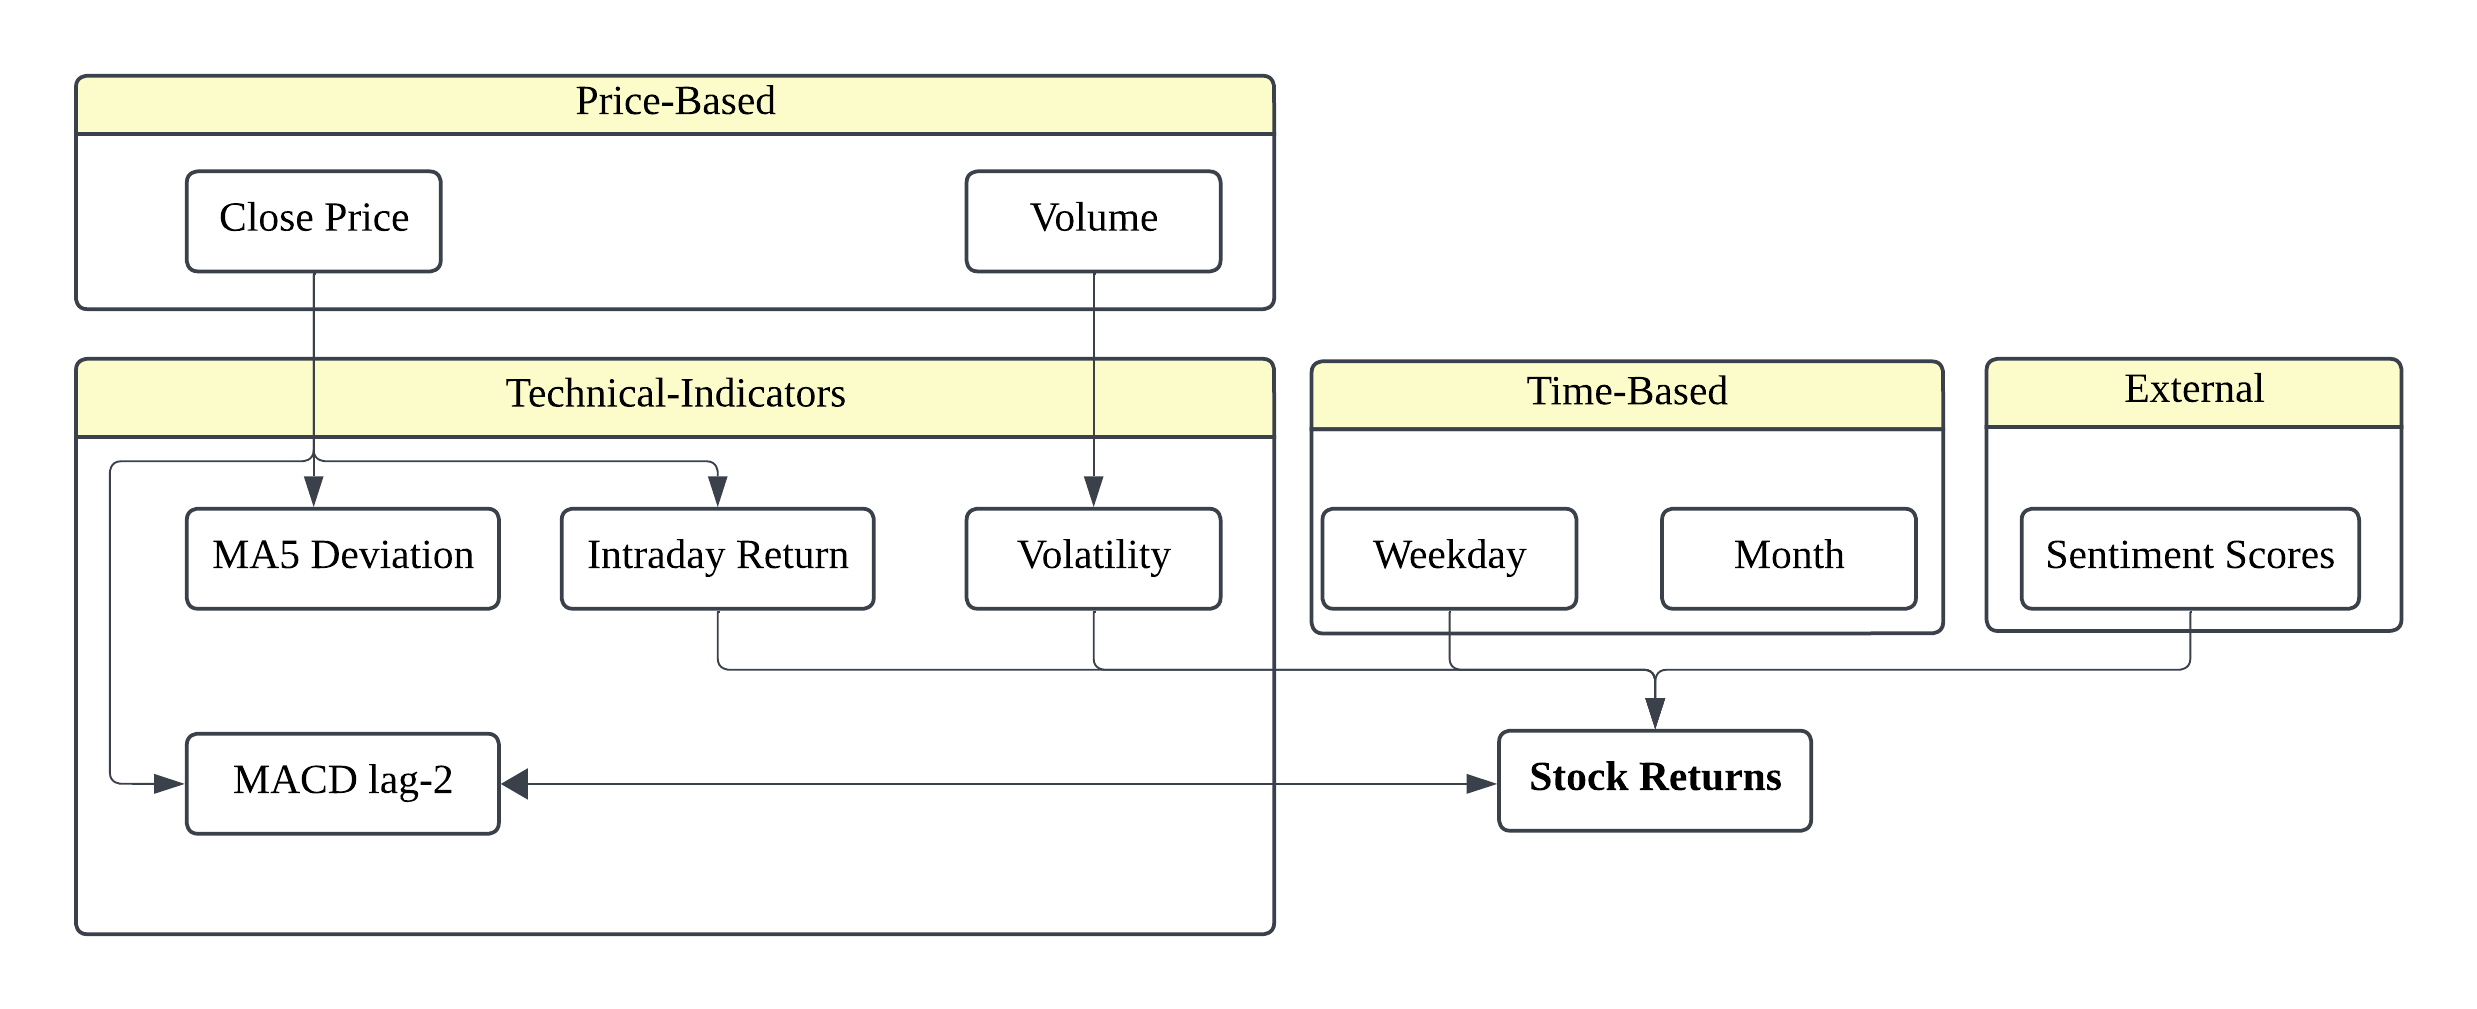
pcmci_plus_feature_selection

The causal structure above shows which factors truly influence stock returns, with stronger connections indicating stronger causal effects

Model Architecture

Our model is based on the DeepAR (Deep Auto-Regressive) architecture, which combines deep learning with probabilistic forecasting. This approach is particularly well-suited for financial time series where uncertainty quantification is crucial.

The model integrates historical returns, technical indicators, and entity embeddings into a concatenated input tensor. An enhanced LSTM with skip connections and variational dropout enables robust gradient flow. The probabilistic output layer generates a Gaussian distribution of future returns, instead of just point estimates.

Key improvements in our architecture include:

  • Orthogonal Weight Initialization: Ensures stable gradient flow during training
  • Variational Dropout (15%): Prevents overfitting while preserving time series patterns
  • Skip Connections: Allow the model to leverage both raw and processed features
  • Hierarchical Structure: Captures both short-term fluctuations and long-term trends
deepar_model

The model processes historical data through specialized layers to produce probability distributions of future returns

Fusion Layer

fusion_layer

To address the limitations of pure time series models and incorporate broader market context, we develop a fusion layer that combines DeepAR predictions with financial and macroeconomic indicators. This approach allows us to refine the primary model's predictions by accounting for fundamental factors that affect stock price movements but may not be fully captured in the historical price patterns alone.

How It Works

Our fusion layer integrates two complementary data sources:

  • Time Series Predictions: Outputs from our DeepAR model, including predictions, actual values, and error metrics
  • Quarterly Financial Data: Company fundamentals like revenue, profit margins, and balance sheet metrics

By combining high-frequency market data with lower-frequency fundamental indicators, we create a more comprehensive view of stock behavior than either approach alone could provide.

Key Features Used

The fusion layer analyzes multiple dimensions of market behavior:

  • Technical Features: Rolling averages of predictions and errors (3, 7, and 14-day windows)
  • Fundamental Features: Financial ratios like profit margins and year-over-year growth rates
  • Temporal Features: Calendar patterns capturing seasonal market behavior
  • Volatility Indicators: Recent market volatility measurements to adjust prediction confidence
Adaptive Prediction Blending

Rather than simply replacing our DeepAR predictions, the fusion layer implements a dynamic blending approach that adjusts based on market conditions:

  • During normal market conditions: 60% weight to fusion model, 40% to DeepAR
  • During high volatility periods: 40% weight to fusion model, 60% to DeepAR

This adaptive strategy recognizes that deep learning models (DeepAR) often perform better during volatile periods, while ensemble methods excel in more stable markets.